Button Text

AWS Glue Monitoring Add-on for Splunk

The AWS Glue Monitoring Add-on for Splunk enables end-to-end visibility into AWS Glue job executions, metadata and operational health. The application connects securely to Amazon Web Services and ingests Glue data using API's. This data is indexed in Splunk, where it is transformed into operational dashboards for monitoring, troubleshooting, and a metadata tracker.

LeanIX SAP Integration Suite Adapter

How AWS Glue ETL Monitoring Works in Splunk

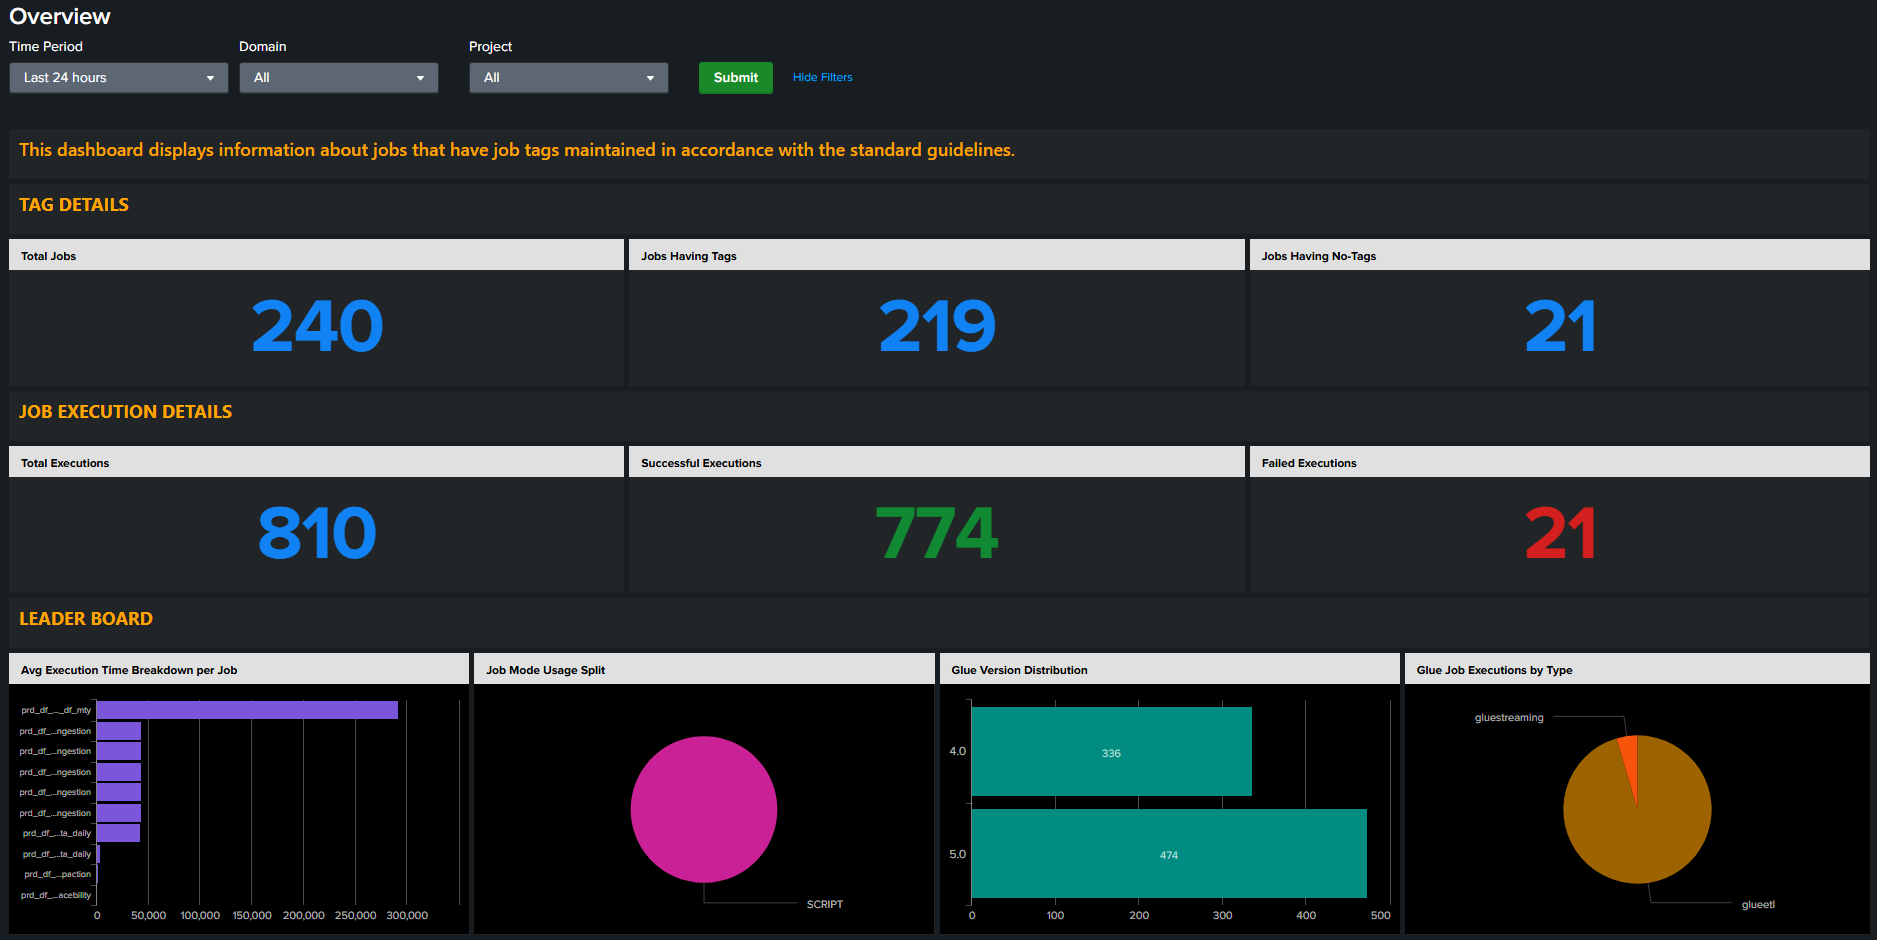
The AWS Glue Monitoring Add-on for Splunk provides a streamlined pipeline for collecting and enriching operational data from AWS Glue. It securely connects to AWS and periodically retrieves Glue job metadata and runtime execution details, capturing key attributes such as execution state, timestamps, tags, IAM roles, versions, and configuration settings. This information is indexed in Splunk, where job master data and run-time execution data are stored separately to enable efficient analysis, historical tracking, and better operational visibility.

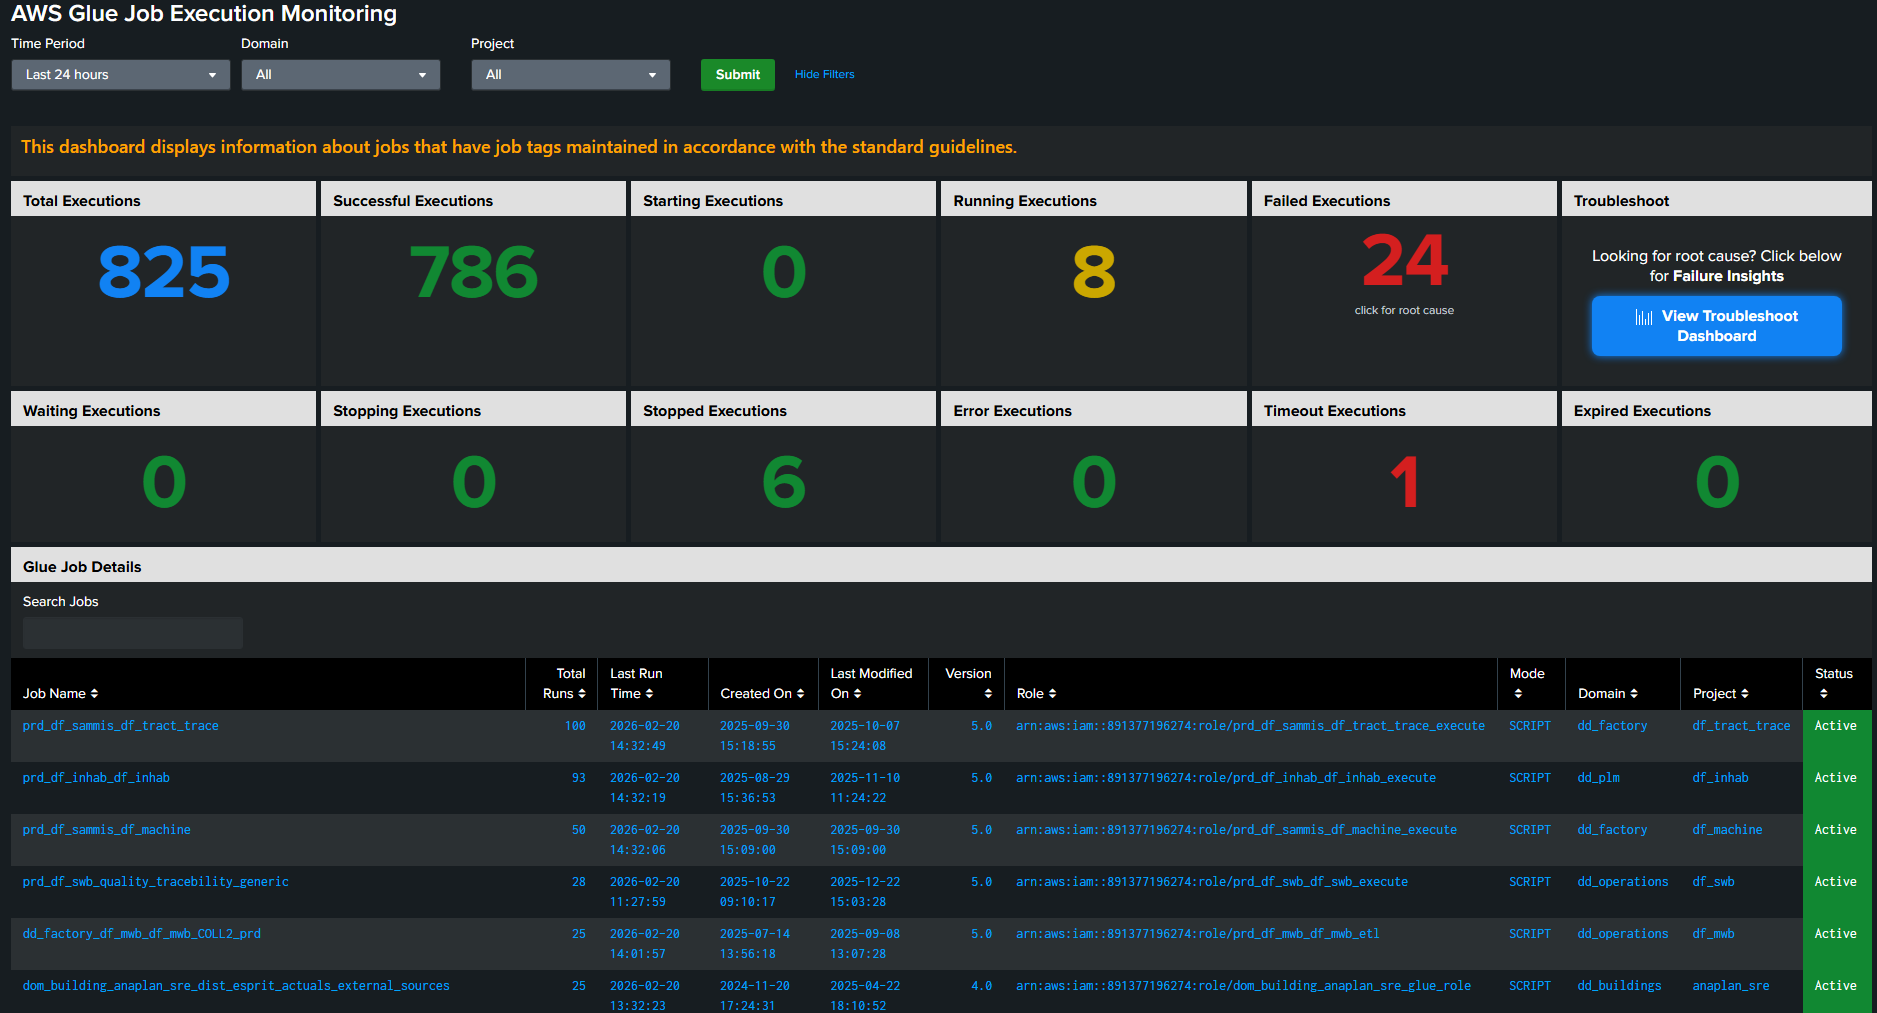
The solution further enriches each job with business context using tags such as Domain and Project, allowing organizations to map technical workloads to business ownership. With this enriched dataset, Splunk delivers near real-time dashboards that visualize execution states, job performance trends, and failure insights. Users can easily drill down from high-level summaries to individual jobs and even to run-level diagnostics, enabling faster troubleshooting and deeper operational analysis. �

Enhance SAP CI Monitoring with AI Copilot

Take your SAP Cloud Integration monitoring to the next level with our Splunk Monitoring for SAP CI – AI Copilot plug-in. This intelligent extension adds AI-driven insights, guided troubleshooting, and faster root-cause analysis to your Splunk dashboards, helping your team resolve issues quicker and work more proactively.

👉 Click here to discover the AI Copilot plug-in

Overview Dashboard

The Overview Dashboard provides a consolidated operational snapshot of AWS Glue job health, execution performance, and tag governance within Splunk. It is designed to give both operational teams and data engineering stakeholders an immediate understanding of platform stability and compliance.

AWS Glue Job Execution Monitoring

The AWS Glue Job Execution Monitoring Dashboard provides a comprehensive operational view of Glue job performance, execution health and reliability trends within Splunk. It is designed to give data engineering teams near real-time visibility into how their ETL workloads are behaving across domains and projects. Master data view ensures complete visibility into both configuration and runtime behavior of each Glue job. Users can further analyze individual job runs.

AWS Glue Job Execution Monitoring - Troubleshoot

The Troubleshoot Dashboard is designed to provide deep operational visibility into failing AWS Glue jobs and accelerate root cause analysis. While the Overview dashboard provides a health snapshot, the Troubleshoot dashboard focuses specifically on instability, recurring failures and execution anomalies.

Metadata Tracker Dashboard

The Metadata Tracker Dashboard provides centralized visibility into AWS Glue job tagging compliance and business classification alignment. It is designed to ensure that all Glue jobs follow enterprise metadata standards and are properly mapped to business domains and projects.

Business Benefits of AWS Glue Job Monitoring in Splunk

The AWS Glue Monitoring Add-on for Splunk empowers organizations with deeper operational visibility and control over their data pipelines. By centralizing Glue job metadata and execution insights in Splunk, teams gain the ability to proactively detect failures, improve governance, and quickly diagnose performance issues. This enhanced visibility helps both technical and business stakeholders ensure reliable ETL operations, maintain compliance, and keep critical data pipelines running smoothly.

Proactive Failure Detection
Instant visibility into failed, timed-out, or errored jobs reduces downtime and speeds up incident response.
Business-Level Observability
By leveraging job tags (Domain, Project), business and IT stakeholders can track ownership, identify impacted business domains & prioritize critical pipelines
Governance & Compliance Visibility
Master data visibility which enables operational audit and configuration tracking such as created on, last modified, version, IAM Role & execution mode
Improved Data Pipeline Reliability
Monitor job run states to ensures stable and predictable ETL performance.

Key Features

Explore the key capabilities of the platform designed to provide deep operational visibility, performance insights, and reliability monitoring for AWS Glue pipelines.

Glue Job Metadata Ingestion
The application ingests AWS Glue job definitions and continuously synchronizes metadata such as job name, version, IAM role, execution mode and associated business tags like domain and project. This ensures that operational dashboards always reflect the latest job configurations without manual intervention.
Execution State Tracking Engine
The solution captures every job run and categorizes it into detailed execution states such as Successful, Running, Failed, Timeout, Expired and more. This structured classification enables near real-time operational visibility and clear differentiation between transient states and critical failures.
Run-Level Drilldown Analytics
The application provides a hierarchical drilldown capability that allows users to navigate seamlessly from a high-level job summary to an individual job view and further down to specific job run details. This layered approach supports efficient investigation and deep operational analysis.
Failure Analytics and Rate Calculation
The platform computes key reliability metrics including total failed executions, failure rate percentage, unique failure count and the number of distinct jobs experiencing failures. These calculated indicators help teams measure pipeline stability and detect recurring operational risks.
Performance Monitoring
The application tracks execution performance metrics such as job start time, completion time, and total execution duration. Historical duration trends allow teams to identify performance degradation, optimize ETL workloads and maintain SLA compliance.
Performance Monitoring
The application tracks execution performance metrics such as job start time, completion time, and total execution duration. Historical duration trends allow teams to identify performance degradation, optimize ETL workloads and maintain SLA compliance.
Tag-Based Business Segmentation
By leveraging Glue job tags, the solution dynamically segments monitoring views by domain, project, or environment. This business-aligned segmentation ensures accountability, ownership visibility and domain-level operational insights.
Tag-Based Business Segmentation
By leveraging Glue job tags, the solution dynamically segments monitoring views by domain, project, or environment. This business-aligned segmentation ensures accountability, ownership visibility and domain-level operational insights.

Ready to monitor SAP CI smarter?

Get in contact! Request a demo to see how Splunky can provide you real-time insights, error analysis, and operational visibility.

Case

How we helped others with their integration challenges